
We don't just talk about it. We build it.
Four things we have designed, built and run in production. Each one started as a problem we had ourselves; too much infrastructure to watch, too much of it invisible, and too much work for the hours in a day. Each one is available to you as a consultancy engagement or a fixed price project.
OMNIA VIDEMUS
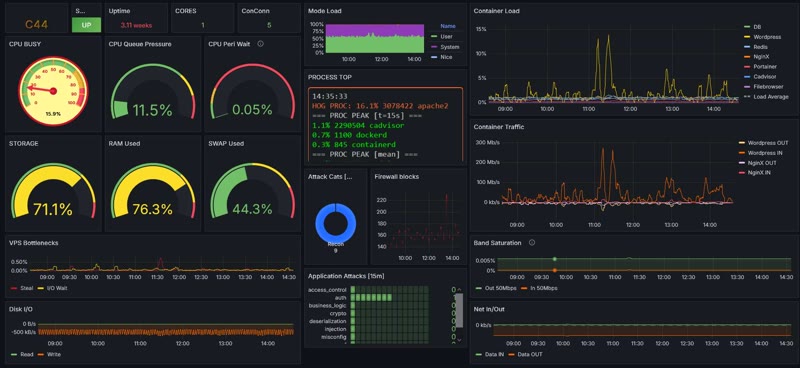
We see all things. A big claim for a Grafana instance, but the screenshot backs it up: thirty-odd panels watching CPU, storage, containers, traffic and firewall blocks on a single screen. Dashboards here get built around questions, so alerts fire when something matters and stay quiet otherwise. Security telemetry sits beside the performance graphs. Most shops run those as separate religions. We don't.
- Whole-estate metrics on Prometheus, from CPU wait states down to application attack heatmaps
- Alerting tuned for signal. If it pages you, it's real.
- Trend lines for capacity, cost and energy, so upgrade arguments arrive with numbers attached
- Security events graphed next to performance, where they belong
- No panels on the open internet. Access is hardened, obviously.
3D Infrastructure Modelling
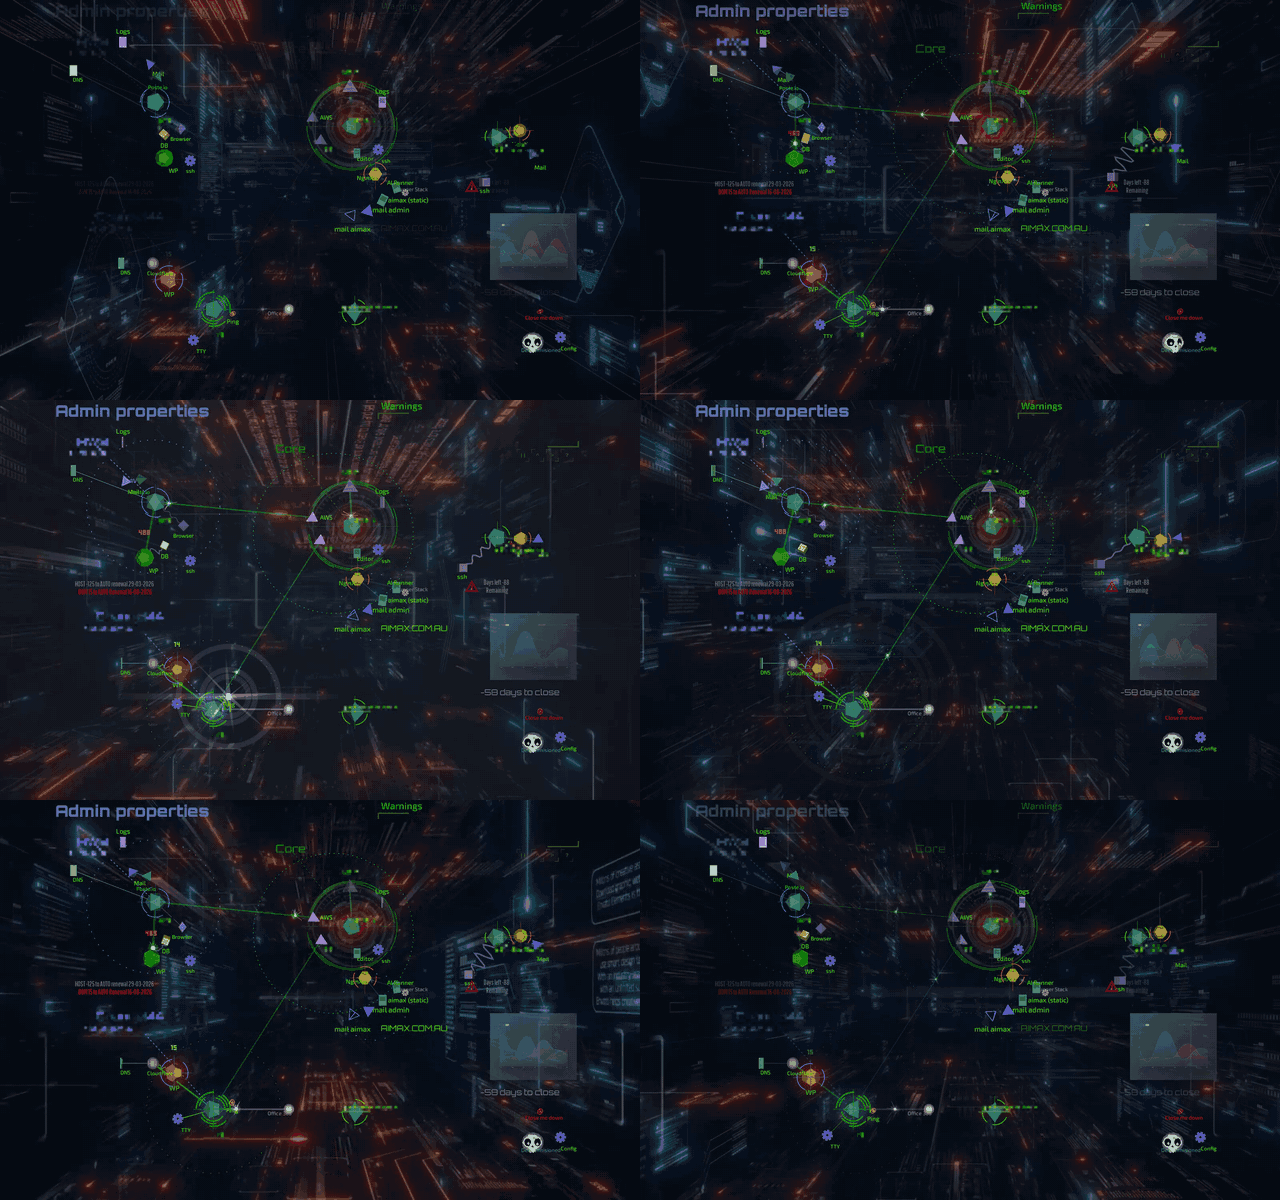
Film FX designers spent decades imagining how computers ought to look. The industry shipped tree views. This framework takes the other road: you define the spatial relationships between objects and it renders them as a navigable 3D world, nodes floating in depth, joined by arcs you can fly through. Infrastructure is merely the first tenant. Point it at a filesystem, or anything with structure, and it maps that too.
- Built-in visual editor, so the world is shaped by hand rather than config file
- Back-end scripting brings live data, alerts and reminders into the scene itself
- Warning markers appear where the problem is, spatially. You notice.
- Currently rendering a full production estate: DNS, mail, databases, cloud services, the lot
- Nothing else does this. We looked.
AI Harness
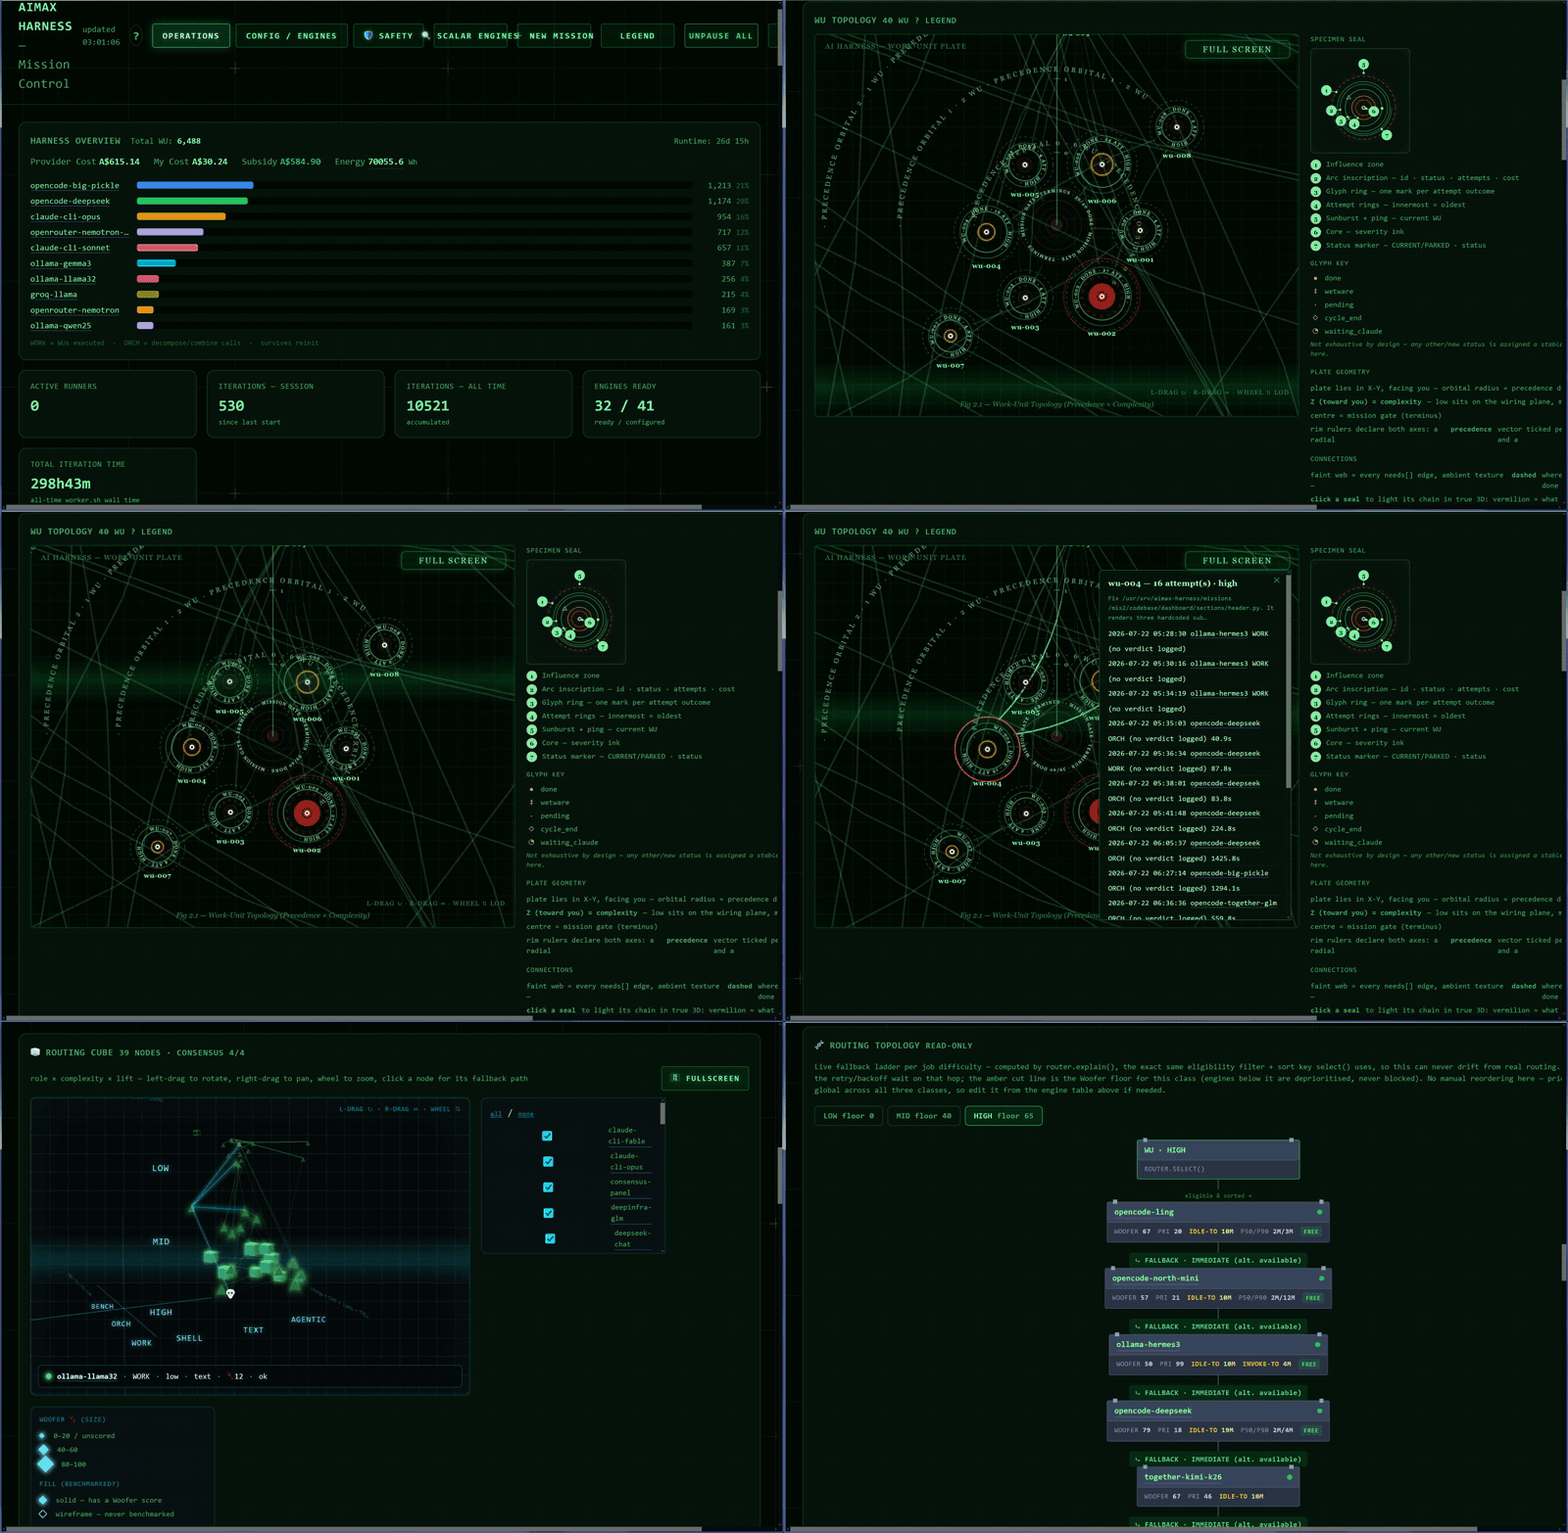
Orchestration for real workloads. The harness breaks a body of work into units, then drives them through 41 commercial and local AI engines, retrying, failing over between providers, escalating, nobody watching. One recent mission ran 26 days: 10,521 iterations across 6,488 work units. And it keeps books. Provider cost, our cost, and the gap between them, which the dashboard politely labels "subsidy". It counts its own watt-hours too.
- Verification chains: work gets checked by a different engine before it counts
- Lowest-tier tasks go to a panel of local engines that vote, so hallucinations get outvoted
- A routing cube plots every engine by role, complexity and lift, then picks accordingly
- Full ledger per mission: dollars, tokens, energy. AI consumption, held accountable.
- Work-unit topology drawn like a Victorian scientific plate, because instrumentation this thorough deserves it
- There's a chat interface too, almost as an afterthought. Pick any model on the roster, dumbest to frontier, local and abliterated included.
The Rosetta Sheet
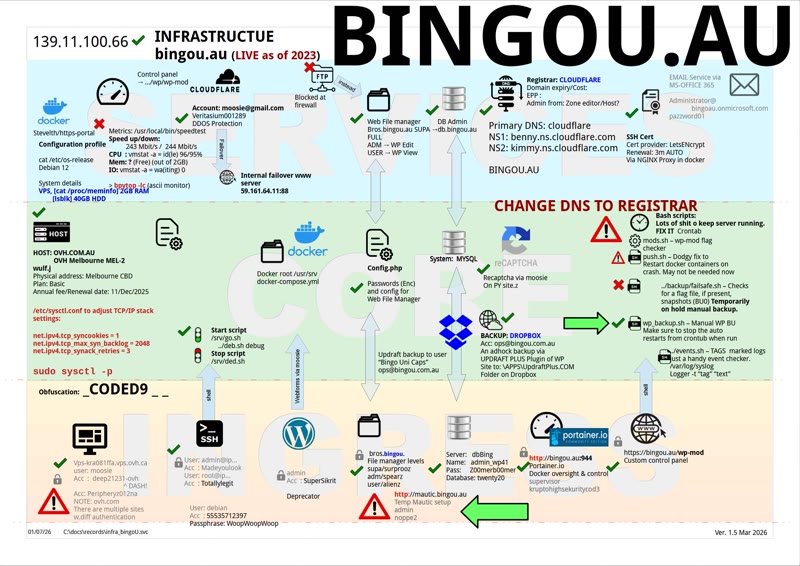
Every operation has the folder. Wikis nobody updated, passwords living in somebody's head, a runbook written in 2019 dialect. The Rosetta Sheet translates the lot into one dense, readable page: hosts, DNS, containers, backups, access paths, and the failure points between them. Thirty-five years of infotech and infosec decide what makes the cut, because knowing what to leave off is the expensive part.
- The whole estate on one sheet, annotated with what's done, broken or pending
- Written for handover, audit, and the 3am incident when nobody who remembers is awake
- Colour-banded layers keep services, core and access apart, so your eye finds things fast
- Dense by design, still accessible
- Hand-built. A person who understands your systems drew this, and it shows.
If any of this looks like something your operation is missing, it probably is.
Hourly consultations, fixed-price projects, or a retainer if you'd like us around.
Say the word.